
memslammer
One job: make an unstable memory overclock throw an error as fast as possible. We reverse-engineered how the fast-failing testers stress RAM, rebuilt each ingredient clean-room, and kept only what measurably shortened time-to-first-error on real unstable settings.
No installer, driver, admin rights or network access. Single-file binaries; checksums in SHA256SUMS.txt. Needs an x86-64 CPU with AVX2 (Haswell, Zen or newer). MIT licensed.
Using it
- Close other programs, start a test, and wait. The default is
verifymode on 90% of free RAM, all threads, until stopped. That's the fastest-failing configuration we've measured. - Any error means the memory overclock is unstable. The GUIs stop at the first error by default.
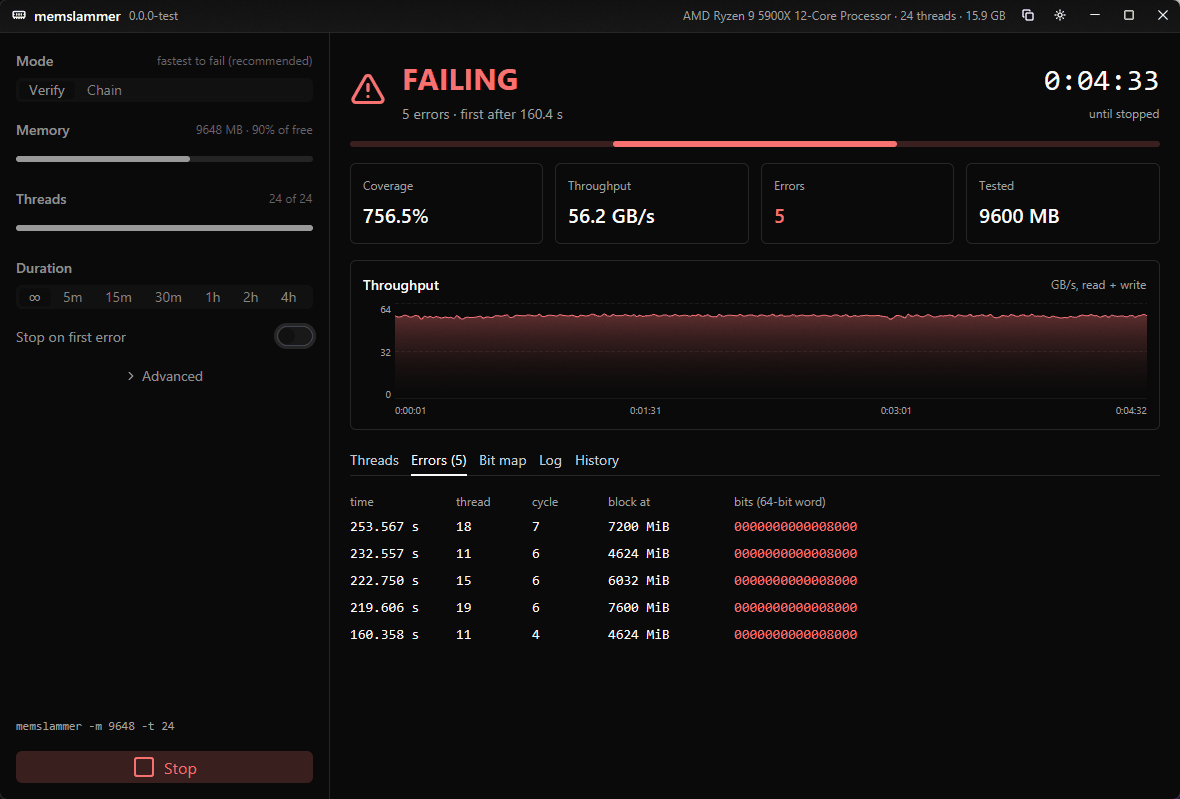
- Errors come faster once the DIMMs are warm. In our runs, the same setting failed within seconds on a hot box (4 s in the lite screenshot below) and took 2–11 minutes from cold. The usual loop (change one timing in UEFI, boot, retest) is a cold start, which is what we optimized for.
- A clean run is evidence, not proof. We tuned on one machine and one kind of fault (tCL/tRCD set too low). Use memslammer to reject bad settings quickly, then validate the final one longer, ideally with other testers too.
Three frontends, one engine
The test engine is a small C library (core/). Each frontend links it statically and only polls its status, so all three run byte-for-byte the same test loops.
| what | Windows | Linux | deps | |
|---|---|---|---|---|
memslammer | command line, scriptable, works over SSH and from live USBs | 99 KB | 84 KB | none (static, musl on Linux) |
memslammer-lite | small native window: plain Win32 controls, or GTK 3 on Linux | 152 KB | 60 KB | none on Windows, GTK 3 on Linux |
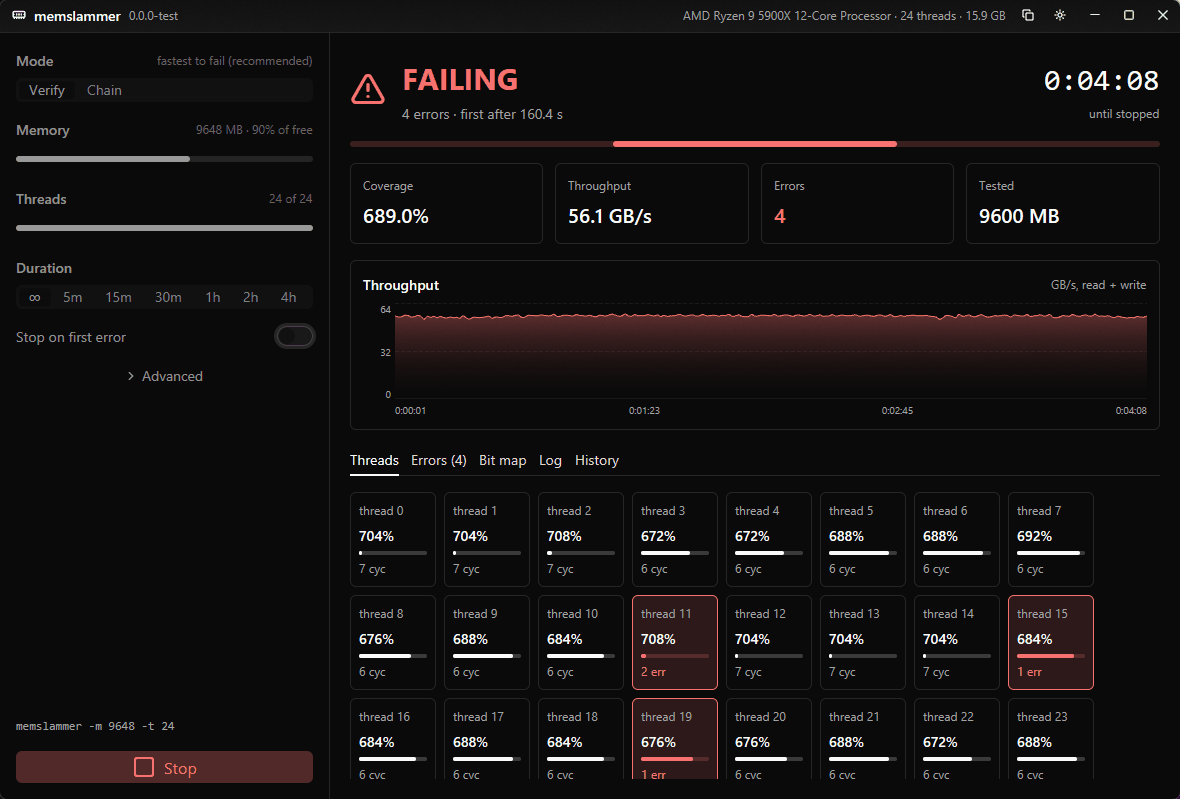
memslammer-gui | GPU-rendered app (GPUI + gpui-kit): live charts, per-thread progress, error list, failing-bit map, run history, copyable report | 14 MB | 32 MB | Vulkan or GL on Linux |
The CLI and lite window ship together in one tiny archive. The full app is a separate download, so if you don't want a big GPU-rendered binary on your test box, you never get one.
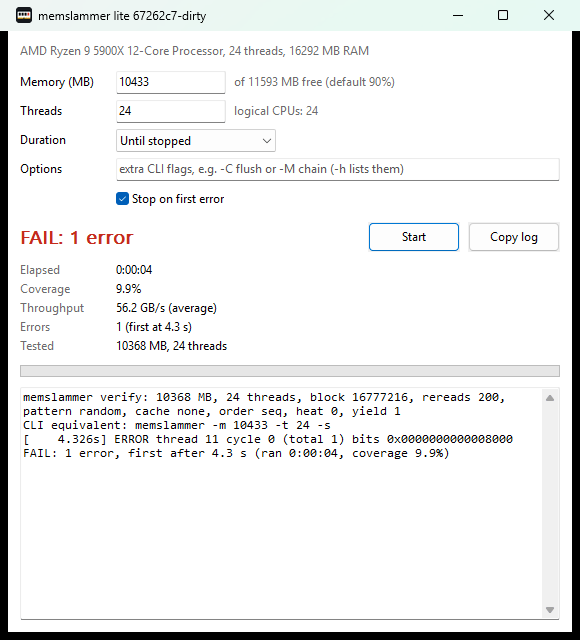
memslammer-lite on Windows: plain Win32, about 150 KB, DPI-aware, taskbar progress, keeps the PC awake while it runs. A real failure, 4 s into a run on a hot box.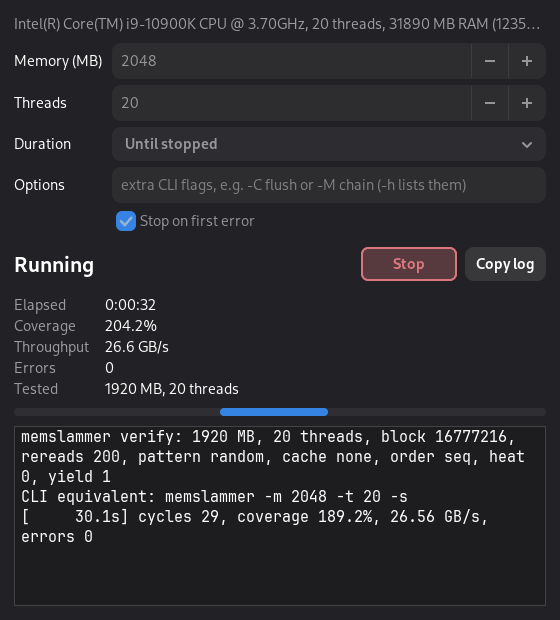
memslammer-lite on Linux: GTK 3, follows your desktop theme, inhibits suspend while it runs.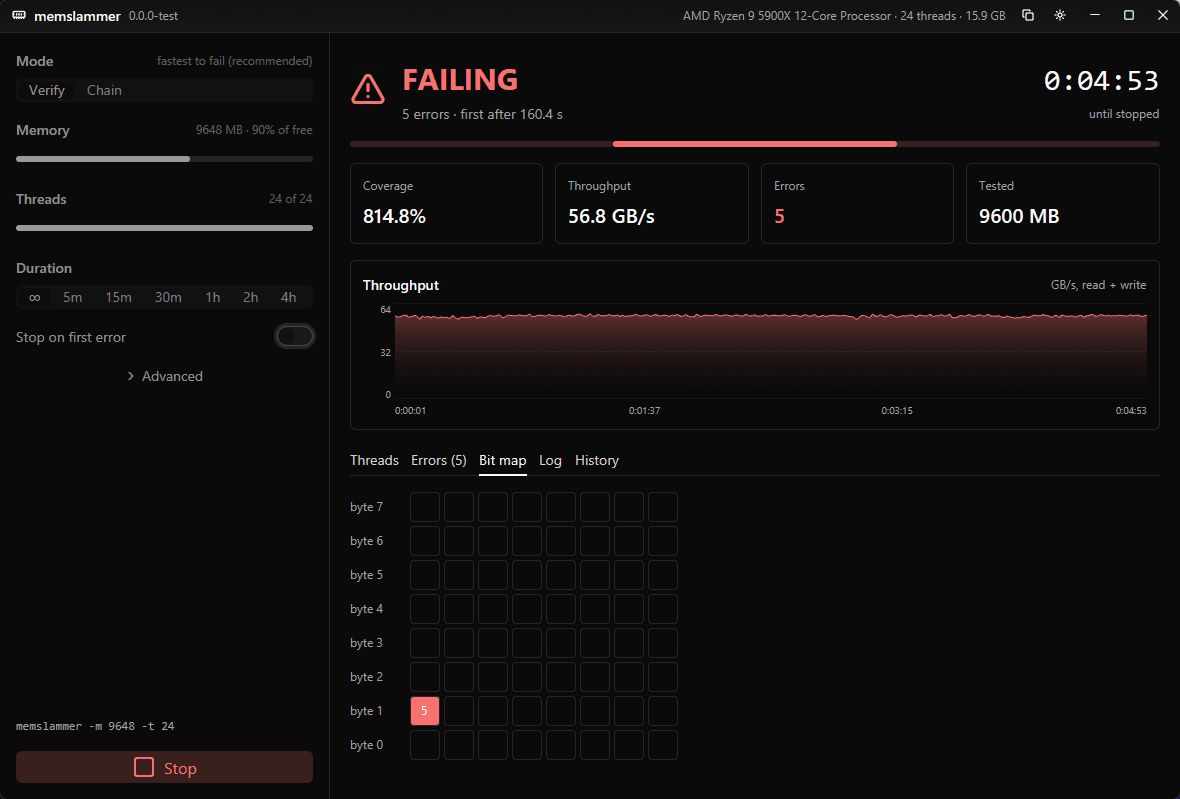
CLI
> memslammer -s            # verify 90% of free RAM, stop at the first error
memslammer verify: 9984 MB, 24 threads, block 16777216, rereads 200, pattern random, cache none, order seq, heat 0, yield 1
[     10.1s] cycles 0, coverage 26.9%, 57.90 GB/s, errors 0
[     20.2s] cycles 0, coverage 53.8%, 57.97 GB/s, errors 0
[     30.2s] cycles 0, coverage 80.8%, 57.86 GB/s, errors 0
[     40.2s] cycles 24, coverage 108.3%, 57.73 GB/s, errors 0
[   41.993s] ERROR thread 5 cycle 1 (total 1) bits 0x0000000000008000
[     42.0s] cycles 24, coverage 113.6%, 57.03 GB/s, errors 1
RESULT tester=memslammer errors=1 first_error_s=41.993 elapsed_s=42.014
Real output on the test box (warm, a few minutes after another run), same unstable setting as everywhere on this page.
Options: -m MB, -t threads, -d seconds, -s stop on first error, -M verify|chain, plus every ingredient below (-h lists them). Exit status: 0 no errors, 1 errors, 2 bad arguments. Ctrl+C stops cleanly and prints the summary. Every GUI shows the equivalent CLI command for its settings.
How the test works
verify (default). Each thread owns a share of the test memory and walks it in 16 MiB blocks. It fills a block with random data (xoshiro256**, fresh seed per block), then re-reads and compares the block 200 times, regenerating the expected values on the fly, so there's no second copy to read. Any mismatch is an error, logged with the time, thread, block offset and the exact bits that flipped. Then it moves to the next block.
What we learned building it (details and raw data in docs/results.md):
- Data entropy is what triggers the fault. The same fill-and-reread loop never failed in 10–15 minutes with low-entropy patterns (a toggle template, a 16-bit multiply chain), and failed in seconds with random data.
- The working set must far exceed L3. With 1 MiB blocks or half the threads, the re-reads stayed in each CCD's 32 MB L3 and nothing failed in 15 minutes. 16 MiB blocks had the best median and the tightest spread. 64 MiB was clearly worse, for reasons we haven't found yet.
- Things that didn't help: forcing DRAM reads with
clflushopt(half the bandwidth, slower to fail),prefetchnta(doesn't bypass L3 on Zen 3), shuffled re-read order, and an AVX FP heat burst between reads (Karhu 1.1's "Stress FPU" idea). All stay available as options so they can be re-tested on other machines. - Starting temperature dominates everything we tuned. The same config moved ~3x between days. Every comparison below interleaves contenders in one session.
chain. A clean-room reimplementation of the chained transform and checksum technique Karhu RAM Test uses (docs/karhu.md). It's kept as a baseline. verify is modelled on the first test of TestMem5's anta777 "Absolut" profile (docs/tm5.md), which caught our test OC in 12 of 13 TM5 failures.
Results
Test box: Ryzen 9 5900X, 2x8 GB DDR4 at 3600 MT/s with tCL 14 / tRCD 14 (deliberately too low, otherwise stable settings). No WHEA or machine-check events: the fault is silent data corruption that only a tester sees. The harness stops each tester at its first error and records the timings the memory controller actually ran.
Cold-start race: 15 min idle before each run, 3 rounds, order rotated
Median time to first error. Per-round times (verify / Karhu / TM5): 394 / 568 / 443, 218 / 368 / 418, 114 / 320 / 319 s. verify was fastest in every round.
Later batches: 5 min idle (the realistic "back from UEFI" case)
| batch | runs (s) | median | start Tctl |
|---|---|---|---|
| Windows, 2026-11-07, 16 MiB blocks | 97, 88, 130, 108, 106, 109 | 107 s | 55–57 °C |
| Linux (live USB), 2026-11-09 | 278, 196, 226, 170 | 211 s | 50–53 °C |
| Windows, 2026-11-08 | 397, 341, 355, 374, 308, 253, 667, 143 | 348 s | 47–55 °C |
Every run failed, the slowest after 667 s. Throughput and time-to-error are the same on Linux and Windows. The ordering by starting temperature is consistent with the finding that warm DIMMs fail sooner.
Limits: one machine, one fault type, small samples. Differences under ~1.5x in median are noise at these sample sizes. We found no tRFC setting that fails quickly, so refresh-timing faults are untested.
Why trust it
- All source is here, MIT. The repo contains no code or binaries from the testers we studied; techniques are written up in our own words.
- Release binaries are built by GitHub Actions from the tagged commit (
.github/workflows/release.yml), with SHA-256 checksums. You can also build them yourself in a minute:make. - It runs as a normal user and only allocates and touches memory. No kernel driver, no network, no telemetry. The full app keeps a small run-history file in your user data folder; nothing else is written.
- A self-test injects bit flips into the test memory while it runs and checks every one is caught, with the right bits, offset and thread (
make test, run in CI).
Build from source
make                 # CLI + lite for Linux and Windows (gcc, mingw-w64, GTK 3 headers)
make gui             # full app for this OS (Rust stable)
make test            # self-test
make release V=0.2.0 # tag + push; CI builds and publishes the release
Layout: core/ engine (portable C, AVX2 loops isolated in engine.c), cli/, lite/ (Win32 + GTK), gui/ (Rust FFI + gpui-kit), harness/ (the benchmark rig behind every number on this page), docs/ (write-ups and raw results).